Payment Method Analysis Sheds Light on Risk Behaviors in British Frequent Bettors
Clara Wagner · Aug 26, 2026
Payment Method Analysis Sheds Light on Risk Behaviors in British Frequent Bettors
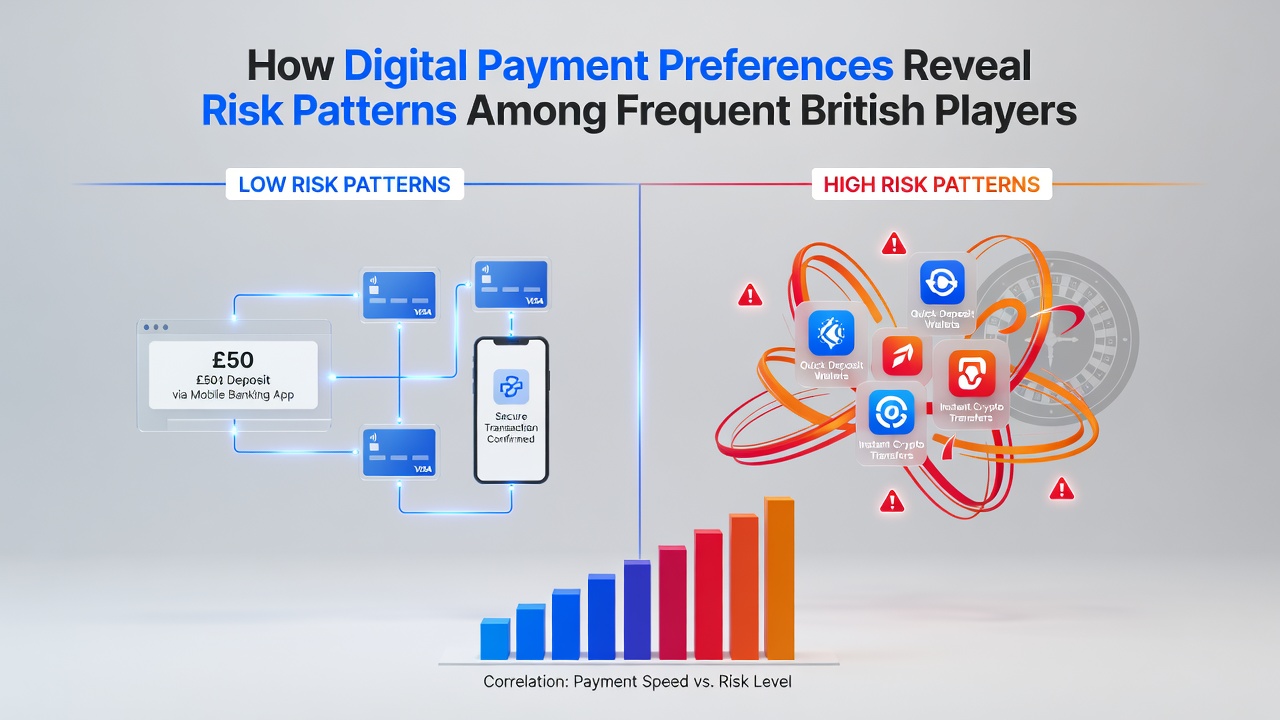
Digital payment preferences among frequent British players have drawn attention from researchers tracking behavioral patterns across online platforms, and data collected through 2026 shows clear correlations between transaction methods and indicators of potential harm. Players who favor credit cards for deposits tend to display higher volumes of rapid successive transactions compared to those relying on e-wallets or bank transfers, according to analyses from academic institutions in multiple countries.
Studies conducted by teams at the University of Sydney have examined transaction logs from thousands of accounts and found that credit card users often complete deposits in clusters within single sessions, while debit-linked methods spread activity more evenly across days or weeks. This distinction emerges repeatedly in datasets covering both sports betting and casino-style games, and it aligns with broader observations from European research centers monitoring similar markets.
Common Payment Options and Their Usage Patterns
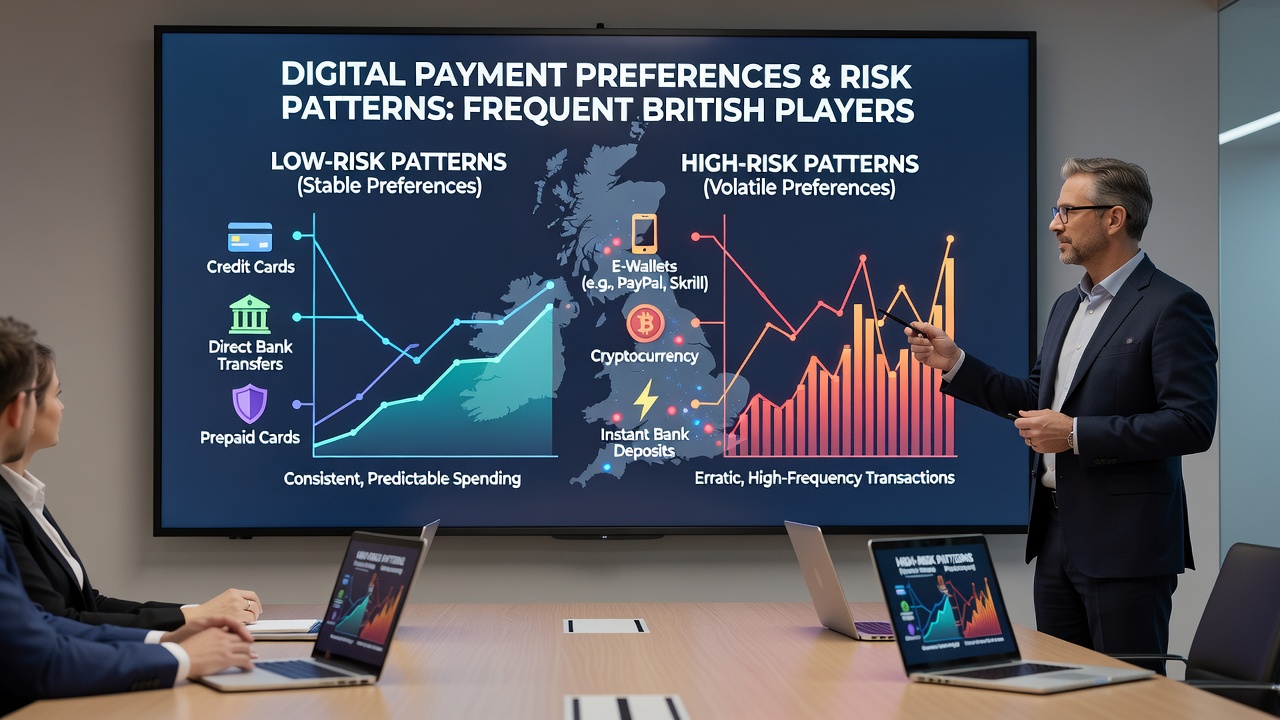
British players access a range of digital methods including credit and debit cards, electronic wallets such as PayPal and Skrill, mobile payment services, and direct bank transfers through systems like Faster Payments. Figures reveal that credit card deposits account for a notable share of activity among those who play several times per week, whereas e-wallet adoption rises among participants who maintain steadier session lengths. One study tracking accounts active in early 2026 noted that wallet users initiated fewer than half the number of impulse deposits seen in credit card cohorts during comparable time frames.
Direct bank transfers show even lower frequency of repeated small deposits, and observers note that these methods require additional verification steps that introduce natural pauses. Mobile options tied to phone billing or apps have grown in popularity since 2025, yet they appear most often among players whose overall spend remains within predefined daily limits set through platform tools.
Indicators Linked to Payment Choices
Researchers have identified several markers that surface more frequently when certain payment methods dominate. Multiple deposits exceeding average session values within short intervals occur at higher rates among credit card users, and this pattern correlates with reports of account self-exclusion requests filed later in the same month. Data from longitudinal reviews indicates that players shifting toward e-wallets after periods of high activity sometimes reduce overall transaction counts by measurable margins.
Another observed trend involves refund and chargeback requests, which surface more often in credit-based accounts according to aggregated industry reports from Canadian regulatory bodies. Those who rely primarily on prepaid or debit options record fewer such reversals, and analysts attribute the difference partly to the immediate deduction effect that limits access to borrowed funds. In August 2026, updated tracking from several European academic consortia confirmed these associations held steady even after platform operators introduced additional friction features for card payments.
Regional and Demographic Variations
Geographic differences appear when payment data is segmented by player location within the UK, with urban centers showing stronger preference for instant mobile methods while rural participants lean toward established bank transfers. Age also plays a role, as younger cohorts adopt app-based wallets at higher rates and older groups maintain loyalty to traditional card networks. Research published through Australian centers highlights parallel findings in comparable markets, where demographic splits produce consistent risk correlations regardless of regulatory environment.
Gender distributions further refine the picture, with male players more frequently using credit options for higher-stake sessions and female participants showing balanced adoption across wallet and debit channels. These patterns do not imply causation on their own, yet they provide operators with additional signals when combined with other behavioral metrics such as time spent on site and game variety selection.
Implications for Platform Design and Monitoring
Platform operators have begun adjusting interface elements based on payment data, for instance by prompting users who rely heavily on credit cards to review spending summaries before confirming deposits. Such adjustments draw from findings in international reports that link payment friction to modest reductions in rapid re-depositing. Academic teams continue to refine predictive models that incorporate payment type alongside other variables, and preliminary results suggest improved accuracy when forecasting accounts likely to trigger responsible gambling interventions.
Collaboration between payment processors and gambling researchers has expanded since 2025, yielding shared datasets that exclude personal identifiers while preserving aggregate trends. These efforts allow for cross-border comparisons that strengthen the reliability of observed patterns without relying on single-market statistics.
Conclusion
Payment method analysis offers one measurable lens for identifying risk patterns among frequent British players, and ongoing studies from diverse international sources continue to map connections between transaction habits and behavioral indicators. As platforms refine their tools and researchers expand longitudinal tracking, the role of digital payment preferences remains a focal point for understanding participation dynamics in regulated markets.